Measurement and Calibration of the Thermal Neutron Diffusion Coefficient with the Triple-Spaced Pulsed Neutron Logging Tool (TSPNL) from Chappell Hill Logging (CHL)
The primary objectives of the TSPNL from CHL are to measure formation sigma, bulk density, and neutron porosity in cased boreholes and in LWD drill collars in open hole.These values are diffusion corrected and borehole compensated. The underling physical model is based on the little known US Patent 3,818,225. During publication of this 1974patent, its claims remained intact, but the main text was incredibly mangled making its teachingsvirtually impossible to follow or to implement.
This patent in turn was based on the GeneralizedAsymptotic Age Model (GAAM) as found in "DIFFUSION MEASUREMENTS WITH PULSED NEUTRON SOURCES" byG. von Dardel and N. G. Sjostrand in Progress in Nuclear Energy, Series I, Physics and Mathematics,Vol. II, p. 183-221, 1958.
The van Cittert Displacement process advocated in this section for the TSPNL toolcalibration in a 100% water bath + casing is a new procedure that goes well beyondthe original concepts of this patent; similarly, density measurements were also not contemplated. These newer procedures are supported by extensive Monte Carlo modeling using MCNP.
Chappell Hill Logging goes well beyond the scope of this earlier work in a number of very significantways. First of all, detection of thermal capture gamma rays in place of thermal neutrons utilizeshigher count rates with better statistical precision. Second, equal time sampling at10 microseconds for each time channel for all detectors permits direct use of powerful standard digital signalprocessing and non-linear least squares methods constrained by physical modeling to extract the maximum possible information from eachdetector. Moreover, certain key issues related to time averaging and integration are avoided.Third, the CHL pulsed neutron system employs three gamma ray detectors,with the third detector being at an extra far spacing with special characteristics that improve countrates and statistical precision at its unusual spacing. Fourth, both the calibration and boreholecompensation of the porosity and formation measurements are accomplished in a 100% fresh water bath + casing using a new procedure called the van Cittert DisplacementProcess(VCDP). Finally, using the theoreticalwork of the Russian author O. A. Barsukov in his book “RADIOACTIVE INVESTIGATIONS OF OIL AND GAS WELLS”(1965), the average formation linear absorption coefficient and bulk density are measured.
A very important aspect of these newer developments: the porosity and bulk density values determined by the Chappell Hill pulsed neutron tool have opposing lithology corrections and so standardopen hole techniques for lithology determination and gas identification are applicable.
Following a burst of high energy neutrons injected into the borehole-formation region of an oil well(as from a Chappell Hill Logging Systems 14-Mev Neutron Generator) and after about 10 to 50 microseconds,four physical neutron processes dominate: (1) fast neutron slowing down, (2) thermalization (approach ofthe neutron energies to equilibrium) , (3) thermal neutron diffusion, and(4) thermal neutron absorption (also called capture). Processes (1 – 3) have insignificantgamma ray signatures, especially when the effective gamma ray energy thresholdof the cement annulus and casing / tool housing is about 200 Kev. In this venue, gamma radiation comespredominantly from thermal neutron capture (process 4) in both the borehole and formation.
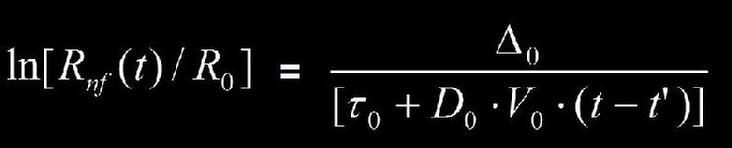
DISCUSSION OF FIGURES ONE & TWO, TOGETHER WITH EQUATION ONE
In FIGURES ONE and TWO (below), the yellow data points are the natural logarithms, time-sampled channel by channel, of the TSPNL NEAR to FAR ratio versus time. (The scatter in these ratios beyond about 800 us reflects mainly FAR detector statistical variations.) The early behavior before 120 us is that due primarily to the CHL neutron generator operation and to slowing down and thermalization in both the borehole and formation regions, plus their interaction. The behavior in the interval (120-400) us is dominated by diffusion and capture in the borehole, whereas the interval (500-1000) us is dominated by diffusion and capture in the formation. The data in FIGURES ONE and TWO were taken with casing in a 100% freshwater bath during a new / novel calibration procedure.
In FIGURE ONE, the red and blue curves represent the differences between straight/plain-jane non-linear weighted least squares fitting (red) and physical modeling/fitting constrained by Equation ONE (blue). NONE OF THE CURVES IN THESE FIGURES ARE STRAIGHT LINES. These red and blue curves are not the same owing to interference between formation capture and diffusion processes with borehole capture and diffusion processes. All of the fits and procedures occur in real time. The main goal is to determine OUTPUTS TAU0 and D0 in Equation ONE, given the tool constants R0, Delta0, and V0, forthe formation and separately for the borehole.
These computed OUTPUTS help determine formation intrinsic sigma, neutron porosity, and bulk density in cased, cemented boreholes and during LWD logging in open hole. Similar procedures apply completely independently for the borehole region's computed OUTPUTS.
Interestingly, these formation analyses are performed BEFORE / WITHOUT the borehole analyses and "stripping of borehole components" doesn't occur. This is backwards from traditional stripping of the "borehole component" to determine the "formation component" !
The green curve in FIGURE ONE is the new physically modeled borehole ratio response:stripping of the formation ratio response does occur prior to the determination of this borehole component !!
In FIGURE ONE, note that the formation (blue) and borehole (green) physically modeled and fitted ratio responses cross at a time dubbed "FEBT" - formation equals borehole ratio response time. The new van Cittert Deconvolution Procedure during tool calibration in FIGURE TWO is performed at FEBT.
In FIGURE TWO, yellow point P (smoothed/filtered) is the observed ratio at FEBT. Point Q in this same figure is the physically modeled formation value at FEBT from FIGURE ONE; Q lies on the same blue curve labeled 2. In this same figure, point R at FEBT lies on the gold curve labelled 3: this gold ratio curve was physically modeled, calibrated, and borehole compensated via the new Via Cittert Deconvolution process. The ratio at point R in gold determines the calibration constant for the NEAR/FAR ratio in the 100% fresh water bath + casing calibrator.
(Shown just below are downloadable pdf files for FIGURES ONE and TWO.)
-------------------------------
Equation One: Ln of Near-Far Ratio versus Time for the
TSPNL from Chappell Hill Logging
Once D0 and TAU0 are determined, D0 alone is used to determine formation neutron porosity, whileboth are used to correct measured SIGMA values for diffusion. Finally, TAU0 and D0, along with a time-averaged ratio, are used to compute the formation linear attenuation coefficient and bulk density.
Even more accurate formation bulk density values are obtained using both TAU0 and D0,along with algorithms established using extensive MCNP Monte Carlo modeling. Again, the newvan Cittert Displacement calibration process is involved.
The Micro Geophysical Model LVFPM isan indispensable tool in the development of these more accurate formation bulk density algorithms.
Chappell Hill Logging and Doctor Neutron have developed the TSPNL tool, along with working C-codefor the Warrior Logging System from Scientific Data Systems.